
How to Identify New vs. Returning Customers based on their Transactions history in Power BI
How to Identify New vs. Returning Customers based on their Transactions history in Power BI Read More
![]()
How to Identify New vs. Returning Customers based on their Transactions history in Power BI Read More
![]()
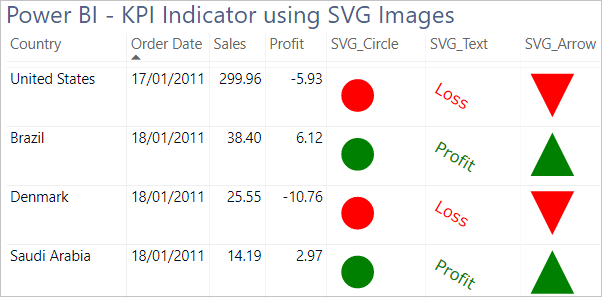
How to use SVG Images in Power BI and create KPIs in Power BI using SVG images? Read More
![]()
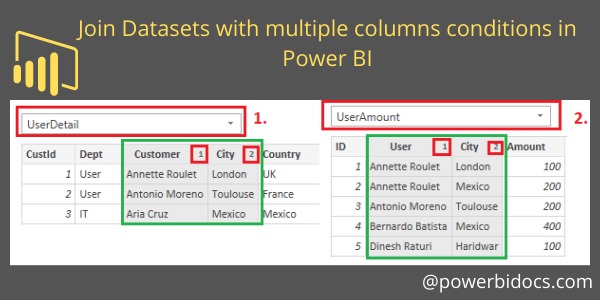
How to Join Datasets with multiple column conditions in Power BI? or Join two tables with multiple columns. Read More
![]()
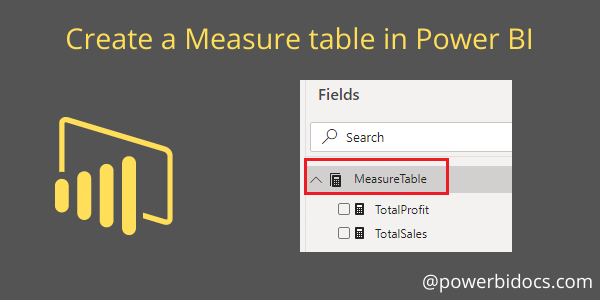
How to create a measure table in Power BI desktop? or Measure table in Power BI. Read More
![]()

How you can draw attention or highlight to a specific visual on a Power BI report page? Read More
![]()
How to set Dashboard or Reports as a ‘Featured on Home’ in the Power BI service? Read More
![]()
What is the difference between Power BI Report and Dashboard? Understand the difference between both. Read More
![]()
How to Build your First Power BI Dashboard? Or How do I create a Dashboard in Power BI? Read More
![]()
How to publish a report in Power BI? Publish datasets and reports from Power BI Desktop to Power BI service. Read More
![]()
How to use Drillthrough filter in Power BI Report? How to create a Drill through Button In Power BI? Read More
![]()

How to Integrating Microsoft Power BI Report with Microsoft Teams? | Add a Power BI tab to Teams. Read More
![]()

How to connect Google sheet to Power BI? Connect a Google Sheet spreadsheet to Power BI as a data source. Read More
![]()

How to setup Data Alert for Dashboard tiles in Power BI Service, learn with an example step by step.
Read More
![]()

How to Create a Clustered bar chart in Power BI? Clustered bar chart Power BI. Read More
![]()
What is Power BI | Introduction to Power BI | Building Blocks of Power BI | Components of Power BI Read More
![]()
