
Smoothed and Leader lines in Microsoft Power BI
Smoothed and Leader lines in Microsoft Power BI Read More
![]()
Learn Power BI visualization & make your report cool & attractive, Power BI support 30+ types of inbuilt visuals and also you can import custom visual from Power BI market place.
Smoothed and Leader lines in Microsoft Power BI Read More
![]()

Unshared Y-axis & Scale to fit for small multiple charts in Power BI, Nov-2022 updates. Read More
![]()

How to create a Area chart in Power BI? Area chart formatting properties. Read More
![]()
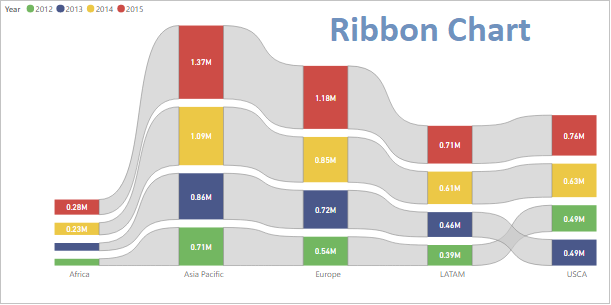
How to create a Ribbon chart in Power BI? Show ranking in Ribbon chart. Read More
![]()

How to create a Small multiples charts in Power BI? Native Small multiples charts visual in Power BI. Read More
![]()

How do you use table heatmap in Power BI? How to create Matrix Table With Heat Map In Power BI? Read More
![]()
What is key performance indicators in power bi? Creating Power BI KPIs.
Read More
![]()

What is Treemap and how do you use it in Power BI? | Treemap visual in Power BI. Read More
![]()
How to Make Power BI Scatter Charts or Bubble Chart in Power BI Desktop? | Storytelling with Power BI Scatter Chart. Read More
![]()

How to Create a Clustered bar chart in Power BI? Clustered bar chart Power BI. Read More
![]()

How to create clustered column chart in Power BI? Clustered column chart visual. Read More
![]()

How to create a 100% stacked column chart in Power BI desktop? 100 % Stacked Column Chart visual in Power BI. Read More
![]()

How to create a 100% stacked bar chart in Power BI desktop? 100 % Stacked Bar Chart Visual in Power BI. Read More
![]()
Power BI Multi-Row Card is used to display summary data or you can say data in group format. Read More
![]()

How to Create a Card in Power BI? Power BI Card Visualizations. Read More
![]()

Power BI – Create a Stacked Column Chart | Stacked Column Chart in Power BI. Read More
![]()

How to Create a Stacked Bar Chart in Power BI Desktop. Power BI inbuilt visual Stacked Bar chart. Read More
![]()

