
Power BI Service allows you to create a dashboard using existing report visuals.
A Power BI dashboard is a single-page canvas that comprises one or more report visuals. It employs visualizations to provide a summarized view of data.
The visualizations present on the dashboard are referred to as ’tiles’ and are placed on the dashboard by report designers.
When you click on any tile on the dashboard, it redirects you to the report page where that specific visualization was originally created.
Before creating a dashboard you have to know How to create a Report & Publish Report to Cloud.
Note: You cannot create a Power BI Dashboard in Power BI Desktop. In Power BI Service, you can create a Dashboard using existing Report visuals.
There are various methods to create a dashboard, let’s break it down step by step:
Apprach-1: Create a Dashboard to using Pin Tiles
Step-1: Open the Power BI report containing the visuals you want to display in the dashboard. Navigate to the ‘Workspace’ and go to the ‘Reports’ tab. Then, open the report.

Step-2: Now hover the mouse pointer over the visual you want to add to the dashboard.
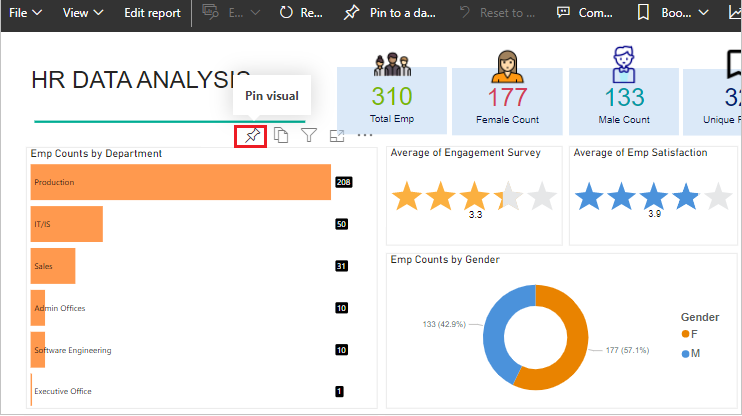
Step-3: Now click to Pin icon and follow below steps:
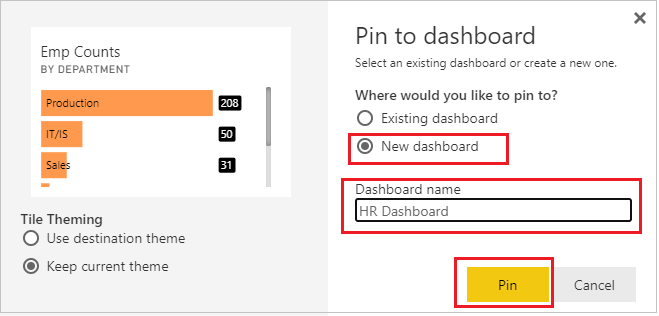
- Existing dashboard: Select if you want to add this visual to existing dashboard.
- New dashboard: Add into new dashboard.
- Dashboard name: Assign new name or select existing dashboard name.
Step-4: Now, pin another visual and select ‘Existing dashboard.’ When we pinned the first visual, a new dashboard was created, so there’s no need to create a new one.

Step-5: As of now, we have successfully pinned two visuals to the ‘HR Dashboard’ dashboard. To view the dashboard, navigate to your report workspace, click on the ‘Dashboard’ tab, and then open your dashboard.

Step-6: Dashboard view.

Step-7: You can resize the dashboard visual.

You can also pin the visual from other reports to “HR dashboard”.
Approach-2: Pin an entire report page to the dashboard
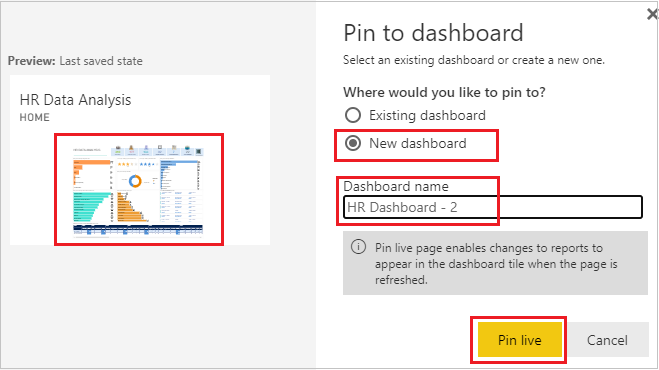
Instead of pinning one visual at a time, you can pin entire report page to using “Pin to a dashboard” option.
Step-1: Open Report & click to “Pin to a dashboard”.

Step-2: Now assign the name to dashboard if you want to create new dashboard.
Step-3: Now go to the dashboard tab and open the dashboard and you will see the entire report page as a dashboard.

Recommended Post: How to create a Report & Publish Report to Cloud.
Hope you enjoyed the post. Your valuable feedback, question, or comments about this post are always welcome or you can leave us message on our contact form , we will revert to you asap.
![]()
This source is really so helpful specially as it is structured from beginner to advanced. The screenshots and related learn ahead links added after every steps makes a great help itself specially for self-study people.
Thanks Akshay🙏