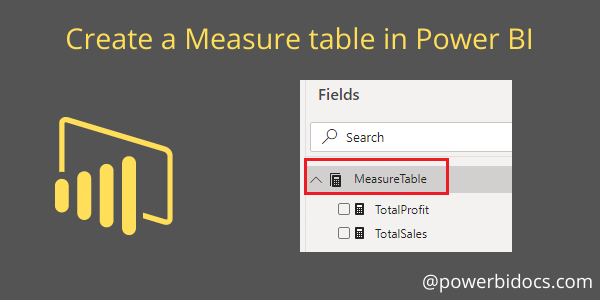
A Measures table is used to store some or all of the measures together in one place.
Suppose you are working with multiple datasets, each containing numerous measures. In such scenarios, it can become challenging to locate specific measures among the columns. In such cases, you can create a measure table to organize and manage your measures more efficiently
Note: Measure table contains only measures not columns.
Let’s Get Started-
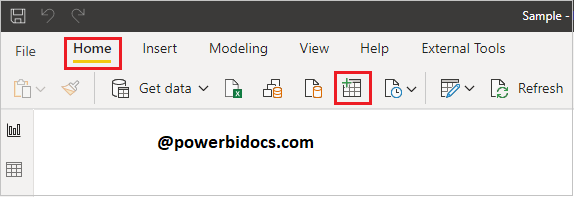
Step-1: Create one table, Go to Home Tab > click on Table.
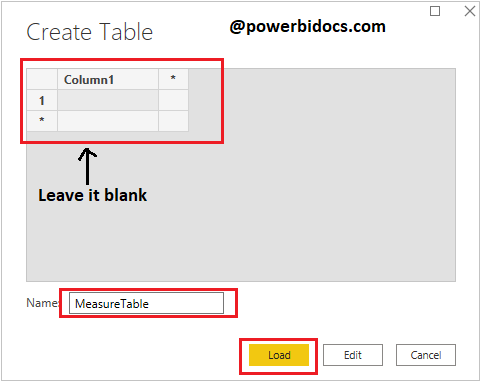
Step-2: Leave the table empty, provide a name for the table, and click on the Load button.
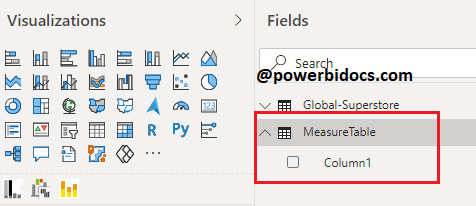
Step-3: The table has been successfully created with one column.
Step-4: Navigate to the Measure tools, and then select the measure you want to move within the measure table.

Step-6: Follow the same steps in case of multiple datasets: Go to the dataset > select a measure, then choose the measure table.
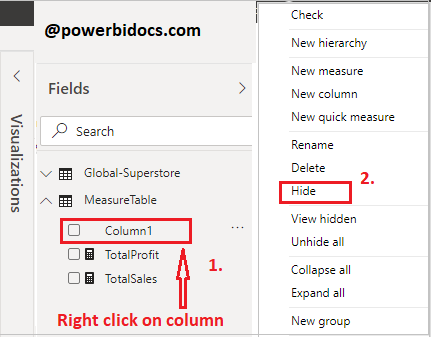
Step-7: Now hide the column from measure table.
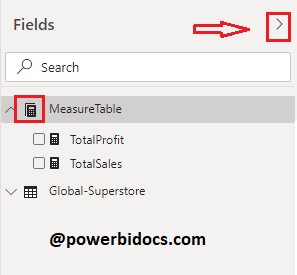
Step-8: Now your Measure table is ready. Sometimes, the Measure table icon may not immediately change to the calculator icon. In this case, you have two options to change the icon:
- Save all changes and re-open the Power BI file.
- Collapse and then extend the Fields Pane arrow icon.
Refer Power BI other post: Power BI tutorials
Hope you enjoyed the post. Your valuable feedback, question, or comments about this post are always welcome or you can leave us message on our contact form , we will revert to you asap.
![]()