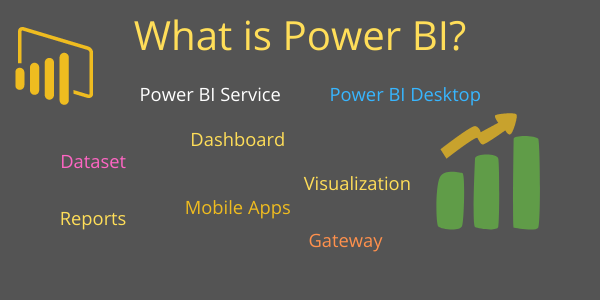
Power BI is a very powerful Data Visualization and Business Analytics tool provided by Microsoft. It help us to provide interactive visualizations, dashboard & BI Reports with self-service capabilities.
With this tool, we can establish connections with a wide range of data sources, including Excel, Text/CSV files, SQL databases, Oracle, and numerous others.
Who uses Power BI?
Mostly used by Technical or Data Analyst professionals but Non-Technical users also can use this.
It is very easy to use, within a few clicks you can create attractive visualizations for your business and no longer business users depends on IT person for gathering, transforming and analyzing data.
Use below link to download Power BI Desktop latest version
https://powerbi.microsoft.com/en-us/downloads/
What are the components of Power BI?
- Power BI Desktop: An application for creating data models, transforming data, and designing reports and visualizations.
- Power Query: A data transformation and ETL (Extract, Transform, Load) tool used within Power BI Desktop to shape and clean data.
- Power Pivot: An in-memory data modeling engine that allows you to create relationships between tables and define calculations using DAX.
- Data Analysis Expressions (DAX): A formula language used to create custom calculations, measures, and expressions in Power BI.
- Visualizations: Charts, graphs, maps, and other graphical representations that provide insights into your data.
- Custom Visuals: Additional visualizations created by the community or third-party developers, available from the Power BI marketplace.
- Reports: Collections of visualizations, tables, and other elements organized to present data insights.
- Dashboards: Interactive canvases that display key metrics and visualizations from multiple reports, providing a consolidated view.
- Power BI Service: The cloud-based platform for sharing, publishing, and collaborating on reports and dashboards.
- Power BI Mobile: Mobile apps that enable users to access and interact with reports on smartphones and tablets.
- Power BI Gateway: Software that facilitates secure data transfer between on-premises data sources and the Power BI Service.
- Power BI Premium: A premium offering providing enhanced performance, dedicated cloud resources, and advanced capabilities.
- Power BI Embedded: Allows organizations to embed Power BI reports and dashboards into custom applications.
- AI-powered Insights: Features that use AI to automatically detect patterns, anomalies, and trends in the data.
- Power BI Report Server: An on-premises solution for publishing, managing, and accessing Power BI reports.
What are Building Blocks in Power BI?

Building Blocks Power BI
- Visualizations: It is a visual representation of data to using Dataset in Power BI Report, like line chart, bar chart, column chart, map, Matrix etc.
- Datasets: It is a collection of data that Power BI uses to create its visualizations.
- Reports: Report is a collection of visualizations that appear together on one or more pages.
- Dashboards: It is single screen presentation of multiple visualizations.
- Tiles: It is a single visualization in a report or on a dashboard, like Pie chart in Dashboard or Report.
Types of Power BI Storage Mode:
Mainly Power BI support two types of Storage Mode
Some key Points of Power BI:
- Data Visualization: Power BI enables users to create compelling and interactive visual representations of their data, making it easier to understand insights and trends.
- Connectivity: It supports connectivity to a wide range of data sources, from popular databases to cloud services, spreadsheets, and APIs.
- Data Transformation: Power Query provides robust data transformation capabilities, allowing users to clean, reshape, and combine data from different sources.
- Data Modeling: With Power Pivot, users can create sophisticated data models by establishing relationships between tables and defining calculated measures using DAX.
- DAX Language: Data Analysis Expressions (DAX) is a powerful formula language used for creating custom calculations and aggregations within Power BI.
- Interactive Reports: Power BI reports offer interactive features like drill-down, cross-filtering, and sorting, allowing users to explore data in-depth.
- Natural Language Q&A: Power Q&A enables users to ask questions in plain language and receive visualized answers, making data exploration more intuitive.
- Mobile Accessibility: Power BI Mobile apps provide on-the-go access to reports and dashboards, ensuring users can stay informed from their smartphones and tablets.
- Collaboration: Power BI Service facilitates sharing and collaboration by allowing users to publish reports to the cloud, collaborate with colleagues, and control access.
- Dashboards: Dashboards provide a consolidated view of key metrics from multiple reports, helping users monitor critical insights in one place.
- Power BI Embedded: Organizations can integrate Power BI reports and dashboards into their own applications, extending data insights to customers and partners.
- Data Refresh: Automatic data refresh ensures that reports and dashboards stay up-to-date with the latest data from connected sources.
- Custom Visuals: Power BI’s marketplace offers a variety of custom visuals created by the community, enhancing the range of visualizations available.
- Enterprise Security: Power BI offers robust security features, including role-based access control and encryption, ensuring data remains protected.
- Power BI Premium: This premium offering provides enhanced performance, dedicated cloud resources, and advanced capabilities for larger organizations.
Hope you enjoyed the post. Your valuable feedback, question, or comments about this post are always welcome or you can leave us message on our contact form , we will revert to you asap.
Recommended Post:
How to create Custom Theme in Power BI

very well organised content . easy to understand
Thanks