Drillthrough enables users to navigate to different report pages within a report.
With the Drillthrough feature in Power BI, we can break down summarized data into actual figures, providing a detailed view of the summary data.
So, let’s begin with an example. Download the sample dataset from the link provided below:
Requirement:
The user wants to view the breakdown of selected sub-category sales year-wise on a separate page with chart visuals or any other type of visual.
Approach-1: Implement basic Drill-through – Navigate through right click on visual
Step-1: Create a Table visual to using category, Sub-category & Sales fields, this is Main Page screen shot.

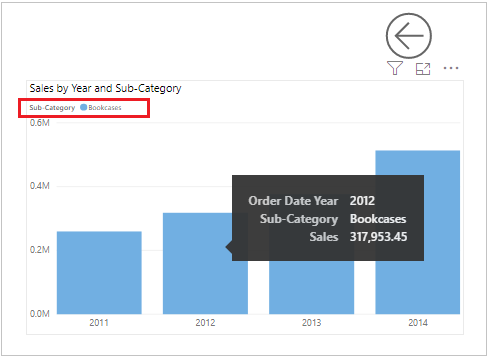
Step-2: Now, create a new report page for drillthrough data. On that page, add a clustered Clustered column chart and display the following fields:

Step-3: Now, drag the field for which you want to enable drill-through into the ‘Drill-through filters’ area.

When you add a field to the ‘Drill-through filters’ in Power BI, a ‘Back’ button visual is automatically generated. Users can utilize this button to return to the report page from which they originated.

Step-4: Now, navigate to the main page, right-click on any sub-category, select ‘Drill Through,’ and click on the Drillthrough page name.
In this case, the Drillthrough page named is ‘Product Details.’

Step-5: After clicking on ‘Page Name,’ it will navigate you to the Drillthrough page and display the year-wise breakdown of the selected sub-category.
Approach-2: How to create a Drill through Button In Power BI?
All steps will be the same as in Approach-1, but instead of right-clicking on the visual value, we will navigate through on a button click.
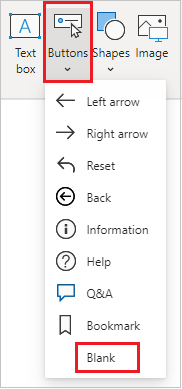
Step-1: Add a blank button to the main page by navigating to the Insert tab and selecting ‘Button,’ then choosing ‘Blank’ Button.
Step-2: Now, select the button and assign a name to it while configuring its basic formatting properties.
And don’t forget to specify the Type as ‘Drill through’ and set the Destination as the Page Name.

Step-3: Now, select any subcategory and click the button while holding Ctrl key.

Step-4: The output displays the selected Subcategory, and you can return to the main page using the back button.

Hope you enjoyed the post. Your valuable feedback, question, or comments about this post are always welcome or you can leave us message on our contact form , we will revert to you asap.
![]()