DAX Parent & Child – PATHITEM Function
How to use DAX PATHITEM Function in Power BI? Parent Child DAX Functions in Power BI. Read More
![]()
Sandeep Raturi – Author at PowerBI Docs. This is Power BI free online tutorial website designed for Software Developers, System Analyst, Data Scientists, and Students who want to get started Power BI quickly and efficiently.
Here, you will get Power BI Desktop, Power Bi Service, DAX functions, Data Visualization & SQL Server related post step by step with an example.
How to use DAX PATHITEM Function in Power BI? Parent Child DAX Functions in Power BI. Read More
![]()

How to use DAX PATHLENGTH Function in Power BI? Parent and Child DAX Functions. Read More
![]()

How to use DAX PATHCONTAINS Function in Power BI? Parent and child DAX function in Power BI. Read More
![]()

Understand Parent and Child DAX functions in Power BI – DAX Path function. Read More
![]()

Apply all filters feature in Power BI Or Apply all button for report filters. Read More
![]()
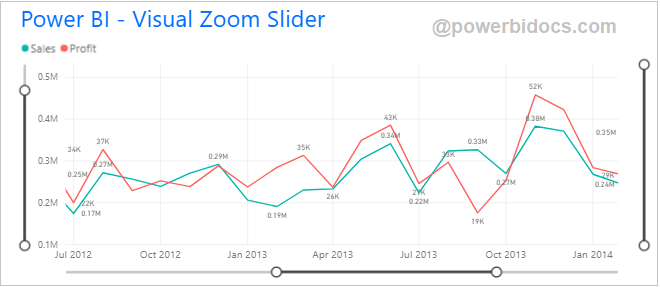
How to add visual zoom slider in Power BI? Or Add zoom slider to your Cartesian charts in Power BI. Read More
![]()

How to create an Index column using Power Query in Power BI? Add Index column in Power BI Using Power Query Editor. Read More
![]()
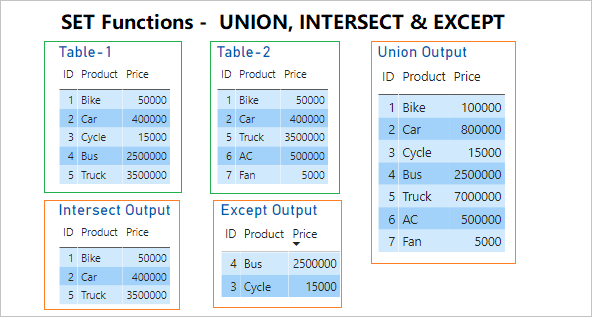
Understand set functions in DAX – UNION, INTERSECT & EXCEPT. Read More
![]()

How to use DAX INTERSECT Function in Power BI? Compares two tables and find common rows. Read More
![]()

EXCEPT DAX Function in Power BI, Usage of EXCEPT DAX Function? Read More
![]()

How to change visual value dynamically based on slicer value selection in Power BI? Change measure using slicer in Power BI. Read More
![]()
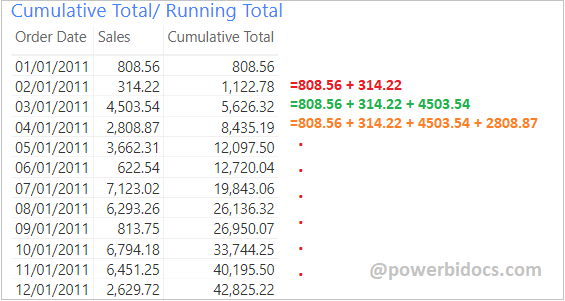
How to calculate Cumulative Sum in Power BI? Calculate Cumulative/Running Total In Power BI. Read More
![]()

Conditional formatting by field value in Power BI, Change chart or Table color based on field value in Power BI. Read More
![]()

How to setup Custom Branding in Power BI service? Upload logo, cover image & theme color in Power BI service. Read More
![]()
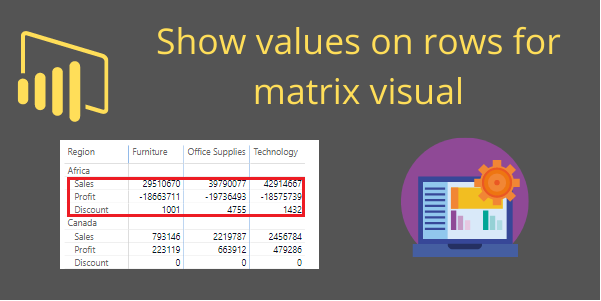
Understand how you can display Values On Rows for Matrix visual in Power BI? What is Switch values to rows in Matrix visual? Read More
![]()
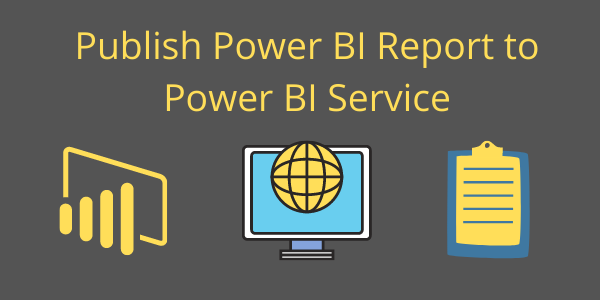
How to publish a report in Power BI? Publish datasets and reports from Power BI Desktop to Power BI service. Read More
![]()
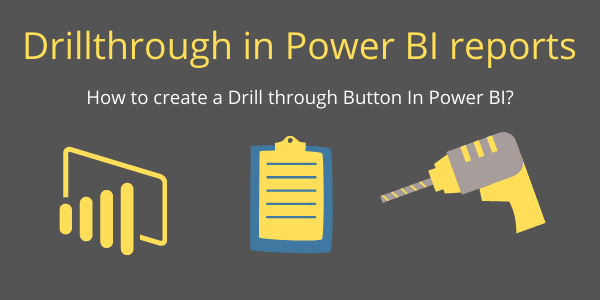
How to use Drillthrough filter in Power BI Report? How to create a Drill through Button In Power BI? Read More
![]()

How to Integrating Microsoft Power BI Report with Microsoft Teams? | Add a Power BI tab to Teams. Read More
![]()
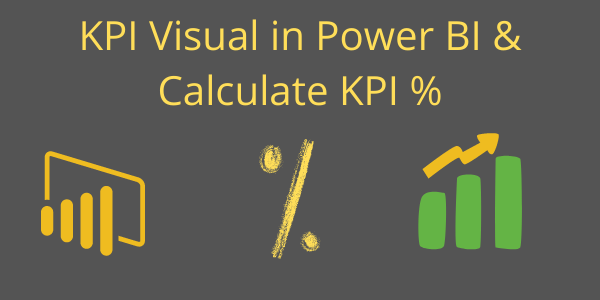
What is key performance indicators in power bi? Creating Power BI KPIs.
Read More
![]()

How to create a custom Display Units in Power BI using DAX function? Or Change display unit based on values in table? Read More
![]()