Power BI November 2020 updates – Power BI has released Visual Zoom Slider feature. Now you can add a Zoom Sliders to cartesian charts (chart which includes horizontal and vertical axes).
Enabling a Zoom sliders feature on chart allows you to easily examine a smaller range of the data in a chart without having to use a filter.
You can enable this feature for Stacked bar chart, Stacked column chart, line chart, Clustered Column Chart, Area chart, line & clustered column chart and line & stacked column chart etc.
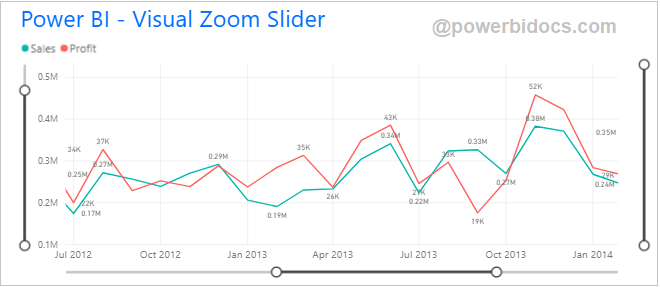
Visual Zoom Slider Demo
Prerequisite
Download Power Desktop latest version – https://powerbi.microsoft.com/en-us/downloads/
Sample Dataset download from here- Global Super Store Dataset
Let’s Get Started-
Follow these steps in order to enable Visual zoom slider-
Step-1: Add a line chart to the Power BI report page with selected fields.

Step-2: Now enable the Zoom Slider – Select ‘Visual’ > Go to the Format bar > Turn on the Zoom Slider.
The ‘X’ and ‘Y’ axis toggles enable or disable the Zoom Slider for each axis.

Step-3: Now turn on Slider labels & tooltips.
- Slider-labels enables a new row of labels next to the slider indicating the full range of the data.
- Slider-tooltips toggle makes tooltips appear as you click and drag each endpoint, showing you the value of your selection as you work with the slider.

Refer other Power BI topics: Power BI tutorials
Hope you enjoyed the post. Your valuable feedback, question, or comments about this post are always welcome or you can leave us message on our contact form , we will revert to you asap.
![]()