In this blog, you will learn how to display multiple values as row headers instead of column headers in the Power BI Matrix visual.
The “Switch values to rows” feature in the Power BI matrix visual allows you to change the arrangement of values in your matrix.
By default, values are displayed as column headers in the matrix, but when you enable this feature, the values are moved to the row headers section.
This can be particularly useful when you want to compare data across different categories or attributes.
Let’s get started
Download the sample dataset from the link below.
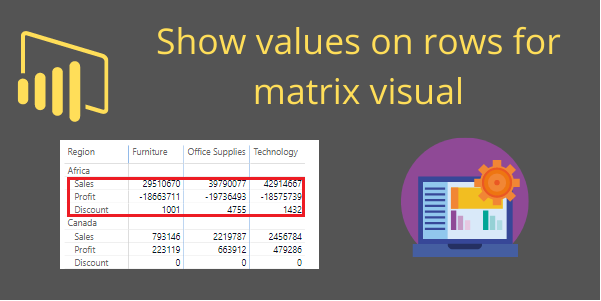
If you have multiple values in the Values section, they will be displayed as column headers in the matrix by default. Refer to the screenshot below for reference.

How to enable Switch values to rows feature:
Enabling this feature can help you efficiently analyze data by providing a different perspective on the relationships between categories and their associated values.
Step-1: Select the Matrix visual.
Step-2: Navigate to the format bar, click on the Values section, and under Options, toggle on “Switch values to row.”

When you switch values to rows:
- Column Headers: The columns will display the attributes or categories you’ve chosen for your matrix.
- Row Headers: The row headers will now display the values that were originally in the values section of the matrix.
- Values: The values that were previously shown as column headers will now be listed as separate rows under the row headers.
Recommend Post: Difference between Table & Matrix visual & Power BI Visualizations
Hope you enjoyed the post. Your valuable feedback, question, or comments about this post are always welcome or you can leave us message on our contact form , we will revert to you asap.
![]()
Thank you it was helpful