In this blog you will understand all about Power BI Data profiling tools (Column quality, Column distribution & Column profile).
The data profiling tools provides you to visual way to understanding more about your data. Using this you can clean, transform, and understand data in Power Query Editor.
Column quality, Column distribution & Column profile these are the main parts of data profiling process.
You can see Data profiling under Power Query Editor window, follow these steps to enable data profiling-
Open Power Query Editor > Go to View tab > and check the following under Data Preview-
Column quality, Column distribution & Column profile.

Note:-
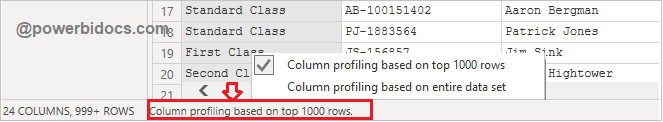
By default, Power Query will perform this data profiling over the first 1,000 rows of your data.
To perform with entire dataset, check the lower-left corner of your editor window to change how column profiling is performed.
Understand data profiling in detail-
Monospaced:
Display data in Monospaced font, it will change the font-family under Power Query editor.
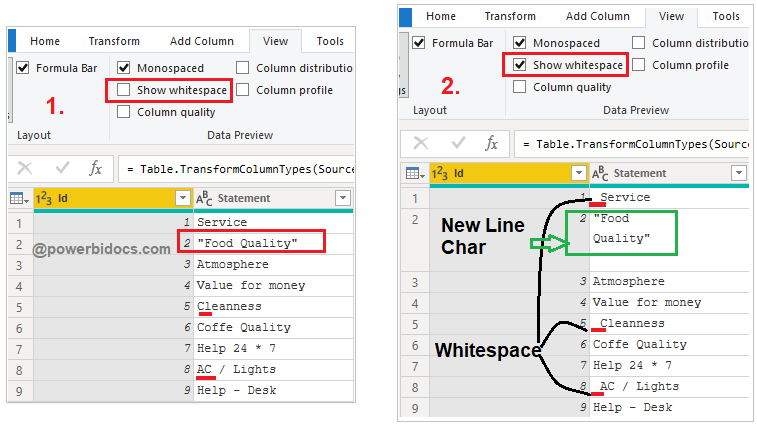
Show Whitespace:
Show WhiteSpace and Newline character, if exist in your data.
Column quality:
The Column quality checks the quality of the data in terms of valid, Error & Empty, also it displayed the percentage of data values associated with the selected table.
- Valid- shown in green
- Error- shown in red
- Empty- shown in dark grey
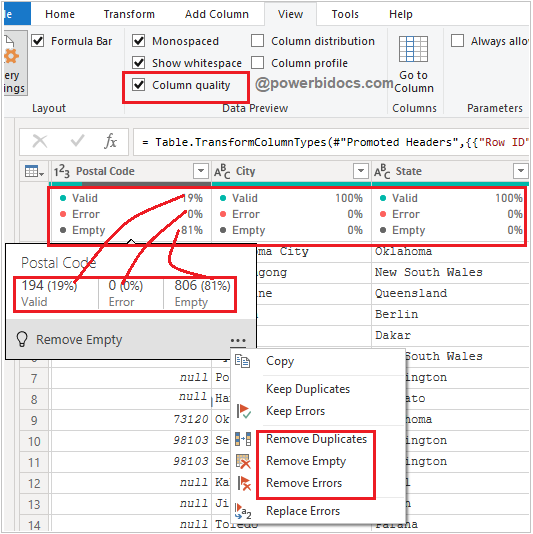
By mouseover any column it will show you numerical distribution of the quality of values throughout the columns, selecting the ellipsis icon(…) it opens some quick action buttons for operations on the values.
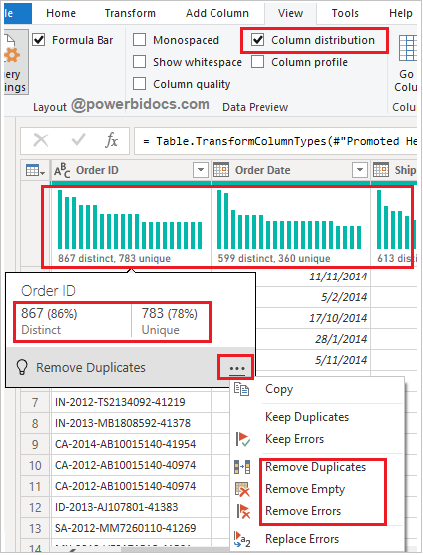
Column distribution:
In this section you can see the distinct and unique records of the values in each of the columns as in histogram visual.
When you mouseover the column and select the ellipsis icon(…) it displays the suggestion for operations on the values.
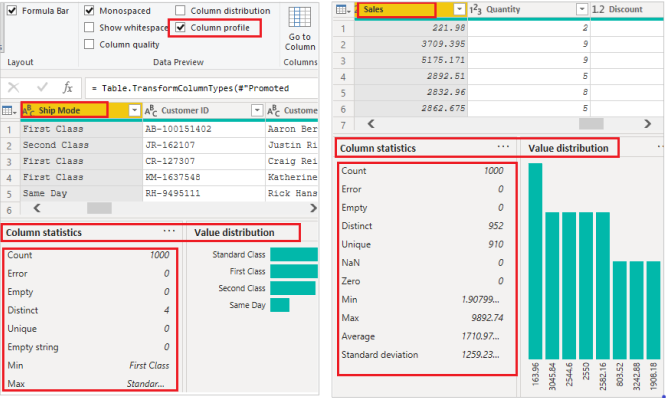
Column profile:
This is most important feature and provides a more in-depth look at the data in a column.
Column Statistics: It displays Count, Error, Empty, Distinct, Unique, Empty String, Min, & Max of the selected column.
Value Distribution: As per value shows data in a bar graph.
Refer other Power BI topics: Power BI tutorials
Hope you enjoyed the post. Your valuable feedback, question, or comments about this post are always welcome or you can leave us message on our contact form , we will revert to you asap.
![]()