Conditional formatting by field value in Power BI
Conditional formatting by field value in Power BI, Change chart or Table color based on field value in Power BI. Read More
![]()
Conditional formatting by field value in Power BI, Change chart or Table color based on field value in Power BI. Read More
![]()

How to setup Custom Branding in Power BI service? Upload logo, cover image & theme color in Power BI service. Read More
![]()

How to create a Rotating Tile in Power BI Desktop? Rotating Tile Custom Visual in Power BI. Read More
![]()

How to create a Hierarchy Chart in Power BI? Hierarchy Chart By Akvelon – Custom Visual. Read More
![]()
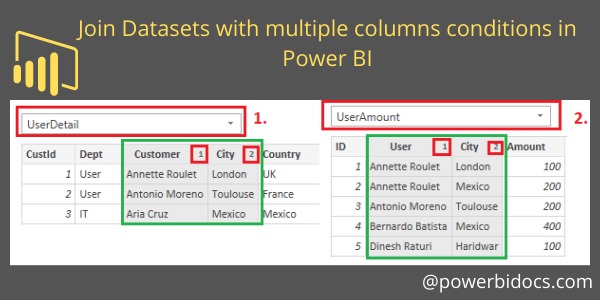
How to Join Datasets with multiple column conditions in Power BI? or Join two tables with multiple columns. Read More
![]()

What is the Display Folder? Organize Power BI columns, calculated columns & measures in Display Folders. Read More
![]()
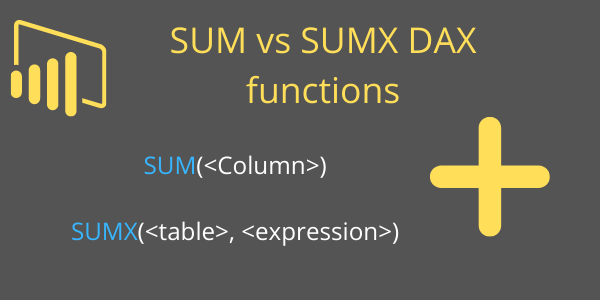
SUM vs SUMX DAX function in Power BI. Understand difference Between SUM & SUMX In Power BI. Read More
![]()

Power BI September 2020 feature – Display Total labels for stacked visuals in Power BI. Read More
![]()

How to setup Data Alert for Dashboard tiles in Power BI Service, learn with an example step by step.
Read More
![]()

Understand Year to Date(TOTALYTD) Dax function working in Power BI. Read More
![]()

How do I create a dynamic label in power bi? – Dynamic Multiselected Value Title In Power BI. Read More
![]()

Personalize visuals allows to end users to change existing visuals with new visuals as per their need. Read More
![]()

Power BI DAX functions AVERAGE, AVERAGEA & AVERAGEX are returns the average (arithmetic mean) of all the numbers in a column Read More
![]()

Power BI DISTINCTCOUNT DAX function is used to counts the number of distinct values in a column. Read More
![]()

With Power BI Import Mode, you can change column name dynamically on visuals, to achieve this you have to follow below steps. Read More
![]()

Is there a way to clear all slicers in Power BI? Power BI – Clear all Slicers Button. Read More
![]()
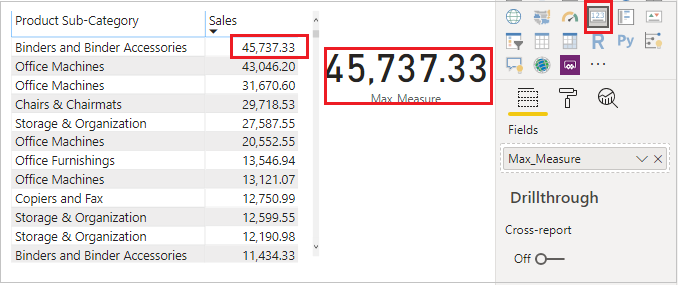
Power BI DAX MAX is a Aggregation function and returns the largest numeric value in a column. Read More
![]()

Power BI DAX functions MIN, MINA & MINX are aggregation functions and returns the smallest value in a column. Read More
![]()

Evaluates an expression and returns a specified value if the expression returns an error. Otherwise, returns the value of the expression itself. Read More
![]()