
Power BI Card visualization is used to display single value like Total Sales, Counts & Single numbers in Report page & Dashboard.
It is a simple and effective way to showcase a specific measure or data point in a concise format.
Refer: Multi Row Card Visual, Rotating Tile card
Let’s start with an example:
If you do not have a sample dataset, you can download it from the link provided below.
Display Total Sales value:
Step-1: In the “Visualizations” pane located on the right side of the Power BI window, click on the “Card” icon to add the Card visualization to your report canvas.

Step-2: Now, simply drag and drop the measure or field that you wish to display within the Card visualization into the “Fields” section of the Card visual.

As you observed, the default behavior is to return the sum of sales, which is due to the default aggregation function being set to SUM.
You can conveniently modify this by right-clicking on the ‘Sales’ field and choosing a different aggregation function based on your requirements, such as COUNT, AVERAGE, MINIMUM, MAXIMUM, and more.
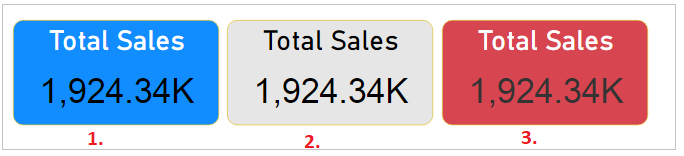
Step-3: Change background color, font size & font family of Card visual
Select car visual> then click on Format Section and use below properties:

- Callout value: Change value font color, font size, display unit etc.
- Category Label: Show & hide column name on Card, change font size, font family etc.
- Title: You can give any Title to Card & change the font size, font family, alignment & background color of card
- Background color: you can change Card background color
- Border: Give border to card & change border color
- General: Mange card height, width , X axis & Y-axis position
Step-4: The final output after configuring all the settings.
What happens if you use string column like name in Card Visual?
Upon dragging the ‘Name’ column into the Card visual, it will naturally exhibit the value of the first row within that column as the default behavior.
However, by right-clicking on the ‘Name’ column, you unlock additional options that offer further customization.

Hope you enjoyed the post. Your valuable feedback, question, or comments about this post are always welcome or you can leave us message on our contact form , we will revert to you asap.
Recommended Post:
Power BI Text Box with Hyperlink
How to create Custom Theme in Power BI
Enable Syncs Slicers in Power BI
![]()