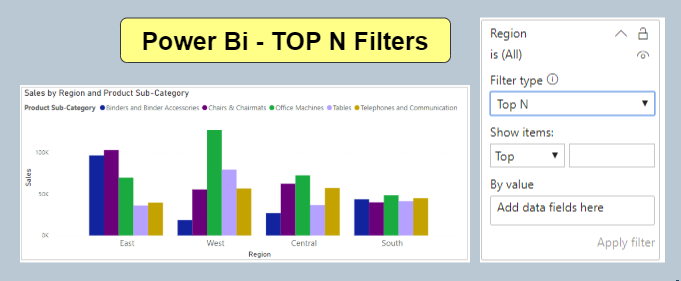
TOP N filters function similarly to the TOP Clause in SQL Server; they filter and return data based on a specified number set by you.
For instance, if you have 100 products and you want to view the sales value of only the top 5 products, you can employ a TOP N filter and input ‘5’ as the value for N.
Refer similar post: Display Top 2 products for each region in Power BI
Let’s start with an example:
If you don’t have a sample dataset, you can download it from the link below.
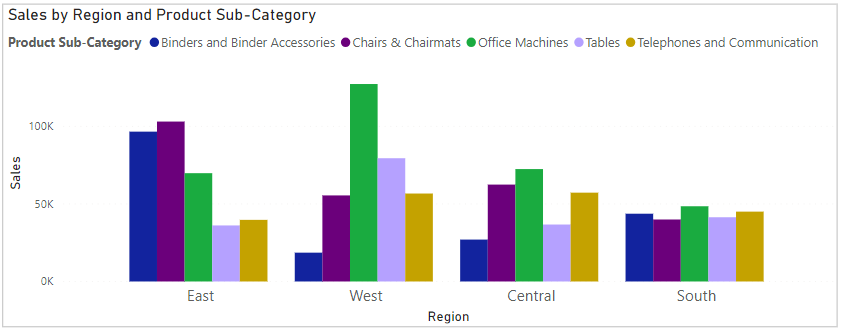
Step-1: Drag a Clustered Column Chart onto a Power BI Page from the Visualization Pane, then select the chart and follow the steps below:
- X-Axis: Drag ‘Region’ from the Orders dataset.
- Legend: Drag ‘Product-Sub-Category’ from the Orders dataset.
- Y-Axis: Drag ‘Sales’ from the Orders dataset.
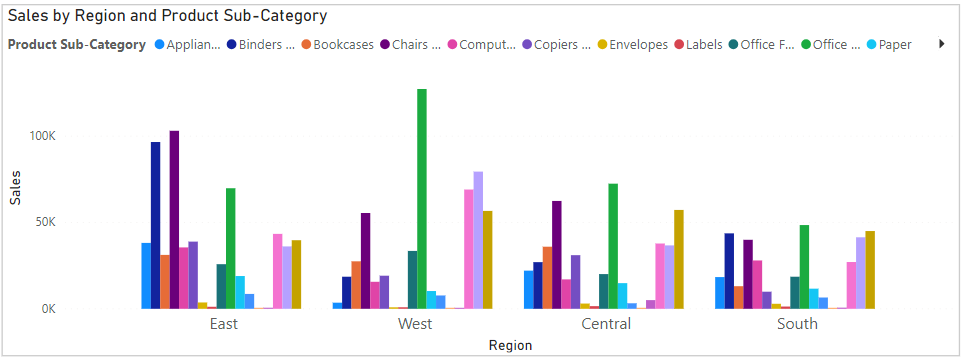
Step 2: If you’ve noticed, each region has more than 10 to 15 product subcategories, but if you want to view only the top 5 sales products in each region, follow the steps below:
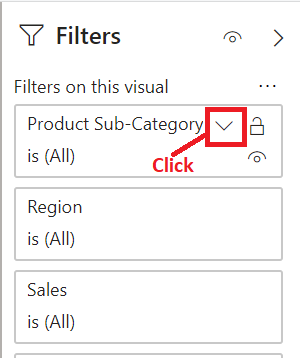
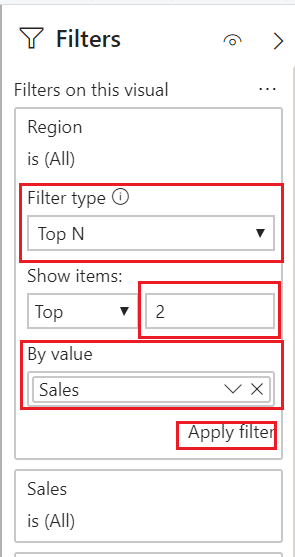
- Click anywhere on the existing chart, then open the Filters Pane on the right side.
- Next, click on the downward arrow icon, as shown in the first image.
- After clicking, select “Top N” from the Filter type dropdown and specify the number of items, as demonstrated in the second image.
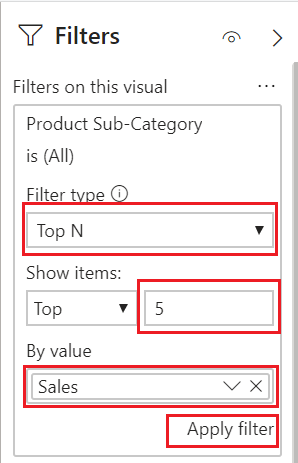
- Now click on Apply filters and see TOP 5 sales data region wise.
Example 2: Suppose, you have four regions sales data in Pie Chart.

But if you are interested in viewing only the top 2 regions’ sales data in a Pie chart, you can follow the same steps as you did earlier for the chart.
After click on Apply filter, result as below:

Hope you enjoyed the post. Your valuable feedback, question, or comments about this post are always welcome or you can leave us message on our contact form , we will revert to you asap.
Recommended Post:
Power BI – Stacked Column Chart
![]()
Pingback: [100% Valid] Microsoft PL-300 Exam Candidate Use Materials
Doesn’t work