
Power BI allows you to change the visual title Dynamically based on slicer selection values.
So, Let’s start with an example, you can download the sample Dataset from below link
Now create two visuals : 1 – Slicer with Region, 2 – Clustered column chart, Region wise Sales

Step-1: Create a measure to enable dynamic title changes on a visual.
TitleTxt =
VAR GetValues= CONCATENATEX(
VALUES(Orders[Region]), Orders[Region], ", ")
RETURN
"Selected Region [ " & GetValues & " ]"

Measure Description:
- Var : Store the values
- Values : returns a one column table that contains the distinct values from the specified column.
- Concatenatex : click here to understand concatenatex working
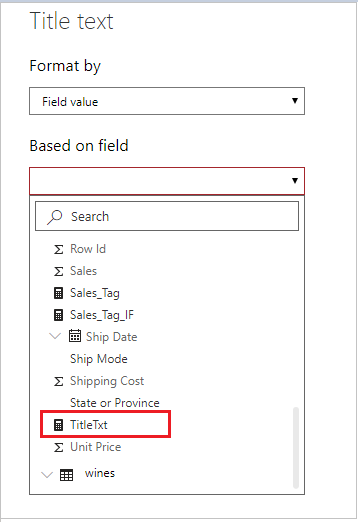
Step-2: Select visual > go to format bar > Under General Tab> turned on Title > click to fx icon.

Step-3: Now select title measure.
Step-4 : Now, choose values from the Region slicer and observe how the chart title dynamically adjusts its behavior.


As you can observe, the title changes dynamically based on the selected Region values.
Refer Power BI other Topics: Power BI Tutorials
Hope you enjoyed the post. Your valuable feedback, question, or comments about this post are always welcome or you can leave us message on our contact form , we will revert to you asap.
![]()