Rotating Tile has ability to display multiple metrics on a single visual that displays one value at a time before flipping to the next value. It is certified by Microsoft Power BI.
Let’s Get stated-
Download the sample Dataset from below link-
Follow these steps in order to create a Rotating tile:-
Step-1: Click on ellipsis icon under Visualization Pane > then click on Get more visuals.(make sure you logged in Power BI desktop)

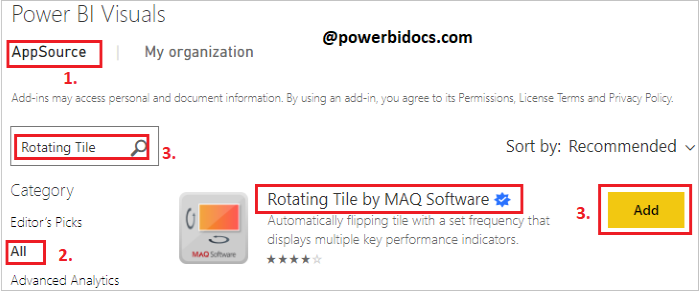
Step-2: Under AppSource Tab > Select Category “All” > Search for “Rotating Tile” > Click on Add button
Step-3: Now drag Sales & Profit columns to visual.

Now format the Rotating Tile
Select the visual and go to format bar & follow these properties-
General: Allows you to set X axis, Y axis, width & height for visual.
Vertical flip on: Change the orientation of rotating tile flips vertically, by default it flips horizontally.
3D effect: you can enable 3D effect for tile and also provide the background color & border to tile.

Animation settings: You can control how fast the tile rotate, set the delay time for flip tile in seconds.
Title settings: Allows you to set the Tile Text size & color.
Label settings: Allows you to set the values color, font size, display units.
See the Output:

Want to know about other visuals, refer this: Power BI Visualizations
Hope you enjoyed the post. Your valuable feedback, question, or comments about this post are always welcome or you can leave us message on our Contact form , we will revert to you asap.
![]()