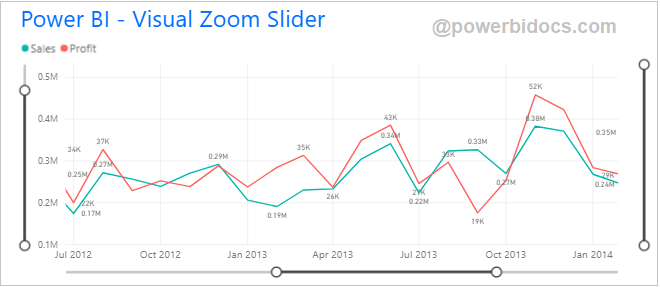
Add Visual Zoom Slider in Power BI
How to add visual zoom slider in Power BI? Or Add zoom slider to your Cartesian charts in Power BI. Read More
![]()
How to add visual zoom slider in Power BI? Or Add zoom slider to your Cartesian charts in Power BI. Read More
![]()
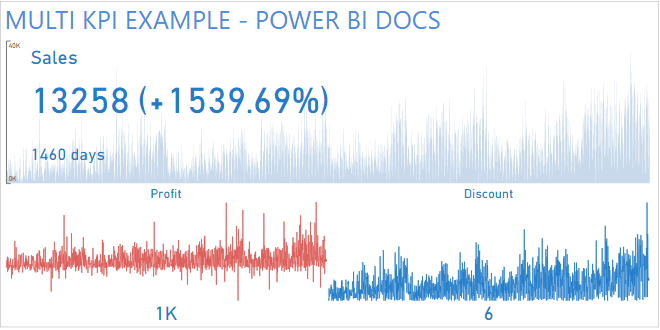
How to create a Multi KPIs in Power BI? Multi KPI custom visual in Power BI. Read More
![]()

How to create a Hierarchy Chart in Power BI? Hierarchy Chart By Akvelon – Custom Visual. Read More
![]()

How to create a Small Multiple Line Chart in Power BI Desktop? Small Multiple Line Chart custom visual in Power BI. Read More
![]()
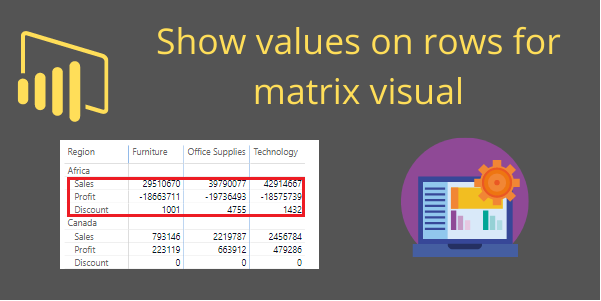
Understand how you can display Values On Rows for Matrix visual in Power BI? What is Switch values to rows in Matrix visual? Read More
![]()

What is Treemap and how do you use it in Power BI? | Treemap visual in Power BI. Read More
![]()
How to Make Power BI Scatter Charts or Bubble Chart in Power BI Desktop? | Storytelling with Power BI Scatter Chart. Read More
![]()

Power BI September 2020 feature – Display Total labels for stacked visuals in Power BI. Read More
![]()

How to Create a Clustered bar chart in Power BI? Clustered bar chart Power BI. Read More
![]()

How to create clustered column chart in Power BI? Clustered column chart visual. Read More
![]()

How to create a 100% stacked column chart in Power BI desktop? 100 % Stacked Column Chart visual in Power BI. Read More
![]()

How to Create a Stacked Bar Chart in Power BI Desktop. Power BI inbuilt visual Stacked Bar chart. Read More
![]()

Differences between Table and Matrix Visualization in Power BI Desktop. Read More
![]()
