Multi KPI custom visual can be used to display multiple KPI values in single visual. This visual is certified by Microsoft Power BI.
Before moving further understand KPI working in Power BI, see here
Let’s Get Started
Download the sample Dataset from below link-
Follow these steps in order to create a Multi KPI visual:-
Step-1: Click on ellipsis icon under Visualization Pane > then click on Get more visuals.(make sure you logged in Power BI desktop)

Step-2: Under AppSource Tab > Select Category “All” > Search for “Rotating Tile” > Click on Add button

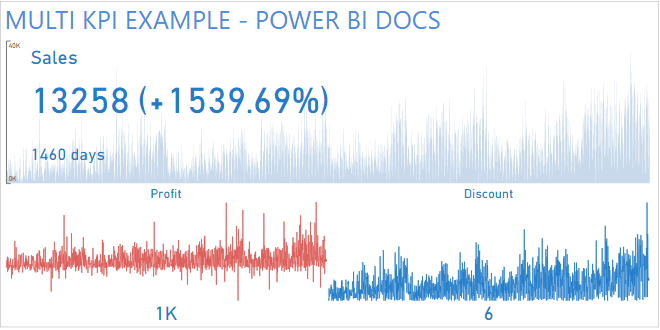
Step-3: Now drag Order Date, Sales, Profit & Discount columns into visual.

By default KPI will displays the values of max(or last) order date & percentage of min(or first) order date, here max order date is 31/12/2014 & min date is 01/01/2011, you can see in below screen shot.

Now understand the KPI Percentage logic for Multi KPI visual
First order date is 01/01/2011 and Sales is 808.56 & Last order sales is 13258

=(13258 - 808.56) * 100 / 808.56
=1539.70%
Now see the logic for some other random date like 25/12/2014

Sales for 25/12/2014 is 22702 & max order date sales is 13258

=(13258 - 22702) * 100 / 22702
=-41.59%

Format the Multi KPI visual
Start with some important properties, select the visual and go to format bar & follow these properties-
General: Allows you to set X axis, Y axis, width & height for visual.
Date: You can change the date format like:- d/M/yyyy, M/d/yyyy
Values: Here you can set the formatting for each values individually.
Y-Axis: Allows you to set the Font color, Text size, & Display unit for Y axis.
Main Chart: Allows you to set the Chart type, color & alternate color, when you hover the mouse on chart then you will see alternate color.

Tooltip: Allows you to modify the details which you want to see as a tooltip, you can mange tooltip for each measures.
KPI: Set the font color & font family for main KPI display and also you can turned on/ off the KPI display.
KPI on hover: Change the appearance of the KPI when a cursor hovers over the KPI.
Sparkline Chart: Set the color for each Sparkline.

Sparkline value: You can set the formatting for each of the chart measure values.
Now see the final output after format the visual

Want to know about other custom visuals, refer this: Power BI Visualizations
Hope you enjoyed the post. Your valuable feedback, question, or comments about this post are always welcome or you can leave us message on our Contact form , we will revert to you asap.
![]()