
The Small Multiple Line Chart (Custom visual) provides the ability to plot a line chart with small multiple line charts within a single visual that you can facet by an attribute value.
Also this chart is certified by Microsoft Power BI. So, Let’s start with an example, download the sample Dataset from below link
In order to import the Small Multiple Line chart custom visual from App Source, follow these steps:-
Step-1: Click on ellipsis icon under Visualization Pane > then click on Get more visuals.

Step-2: After that one pop-up window will be open, enter your power bi account mail id & password. If you already logged In into power bi desktop then this window will not come.
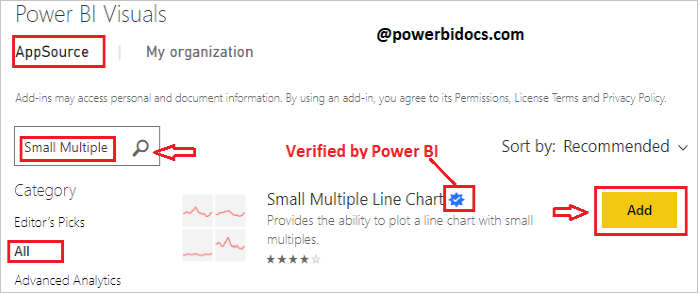
Step-3: After logged In, you will see the Power BI visual pop-up window. Now follow these steps-
Under AppSource Tab > Select Category “All” > Search for “Small Multiple Line Chart” > Click on Add button
Step-4: Visual imported successfully, now drag visual to report page.

Step-5: Now drag Region column to Small Multiple, Order Date Year to Axis & Sales, Profit to Values section.
So, it will display the small multiple line chart region wise under one single visual as shown in below screen shot.

Format the Small multiple line chart
Now set the small multiple line chart format like, font size, font family, X & Y axis, SM layout, SM styling & Line styling.
Now select the visual and go to format bar & follow these properties-
General: Allows you to set X axis, Y axis, width & height for SM visual.
SM Layout:
- Set the Column Sizing, you can display the number of columns per row as per your choice.
- Column Spacing: Provide the space between columns.
Row Sizing: You can fixed the row heights & also give the space between each rows.

SM Heading: Turn on SM heading & set font color, position, alignment, text size & font family. Here SM heading is Region text.
SM Styling: Allows you to set the background and alternate background color for small multiple line chart. Also you can set the border & border style for chart.
Line Styling: Here you can set the line color for Sales & profit, also you can enable the show area, change the Shape & line style
X-Axis: Allows you to set the Title, Font color, Font size, Text size, show label, Gridline, Axis domain line & color.
Y-Axis: Allows you to set the Title, Font color, Font size, Text size, show label, Display unit & Gridlines.
Legend: Set legend Title, Font color, Text size & Position for legend.
See the final output of Small multiple line chart

Want to know about other visuals, refer this: Power BI Visualizations
Hope you enjoyed the post. Your valuable feedback, question, or comments about this post are always welcome or you can leave us message on our Contact form , we will revert to you asap.
![]()