Home » Power BI Tutorials by Sandeep Raturi »
Power BI Tutorials by Sandeep Raturi
Sandeep Raturi – Author at PowerBI Docs. This is Power BI free online tutorial website designed for Software Developers, System Analyst, Data Scientists, and Students who want to get started Power BI quickly and efficiently.
Here, you will get Power BI Desktop, Power Bi Service, DAX functions, Data Visualization & SQL Server related post step by step with an example.


Power BI – Clustered Bar Chart
How to Create a Clustered bar chart in Power BI? Clustered bar chart Power BI. Read More


Power BI – Clustered Column Chart
How to create clustered column chart in Power BI? Clustered column chart visual. Read More

Create Power BI first Report
How to Create your first Report in Power BI Report? Or Creating Reports in Power BI step by step. Read More
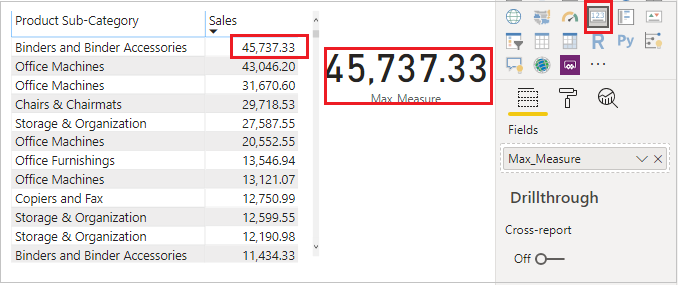
DAX – MAX, MAXA & MAXX Functions
Power BI DAX MAX is a Aggregation function and returns the largest numeric value in a column. Read More

DAX – MIN, MINA & MINX Functions
Power BI DAX functions MIN, MINA & MINX are aggregation functions and returns the smallest value in a column. Read More

How to Change Data Source in Power BI
How To Change Data Source Of Existing Report In Power BI? Read More

Power BI Analytics Pane
What is Analytics Pane in Power BI? How to Use Analytics Pane in Power BI Desktop? Read More


DAX – CONCATENATEX Function
Power BI DAX CONCATENATEX function concatenates the result of an expression evaluated for each row in a table using the specified delimiter. Read More

DAX – CONCATENATE Function
Power BI CONCATENATE DAX function is used to join two text strings into one text string. Read More

DAX – RIGHT Function
Returns the specified number of characters from the end of a text string. Read More

DAX – LEFT Function
Left DAX function – Returns the specified number of characters from the start of a text string. Read More

DAX – UPPER Function
UPPER Function DAX Power BI – The UPPER DAX function converts the given string into uppercase letters. Read More


Power BI – 100% Stacked Column Chart
How to create a 100% stacked column chart in Power BI desktop? 100 % Stacked Column Chart visual in Power BI. Read More

Power BI – 100% Stacked Bar Chart
How to create a 100% stacked bar chart in Power BI desktop? 100 % Stacked Bar Chart Visual in Power BI. Read More
Power BI – Multi-Row Card Visualization
Power BI Multi-Row Card is used to display summary data or you can say data in group format. Read More

DAX – IFERROR Function
Evaluates an expression and returns a specified value if the expression returns an error. Otherwise, returns the value of the expression itself. Read More

Power BI – Card Visualization
How to Create a Card in Power BI? Power BI Card Visualizations. Read More