
The RUNNINGSUM function in DAX calculates a cumulative sum over a specified range of data.
Note: This DAX function will work at visual calculation expression.
Let’s get started
Import below dataset into Power BI Desktop
| OrderDate | SalesAmount |
| 01-01-2023 | 200 |
| 01-02-2023 | 150 |
| 01-03-2023 | 300 |
| 01-04-2023 | 120 |
| 01-05-2023 | 450 |
| 01-06-2023 | 350 |
| 01-07-2023 | 500 |
| 01-08-2023 | 100 |
| 01-09-2023 | 600 |
| 01-10-2023 | 400 |
| 01-11-2023 | 700 |
| 01-12-2023 | 100 |
| 01-01-2024 | 250 |
| 01-02-2024 | 300 |
| 01-03-2024 | 400 |
| 01-04-2024 | 350 |
| 01-05-2024 | 100 |
| 01-06-2024 | 450 |
| 01-07-2024 | 550 |
| 01-08-2024 | 200 |
| 01-09-2024 | 650 |
| 01-10-2024 | 300 |
| 01-11-2024 | 750 |
| 01-12-2024 | 300 |
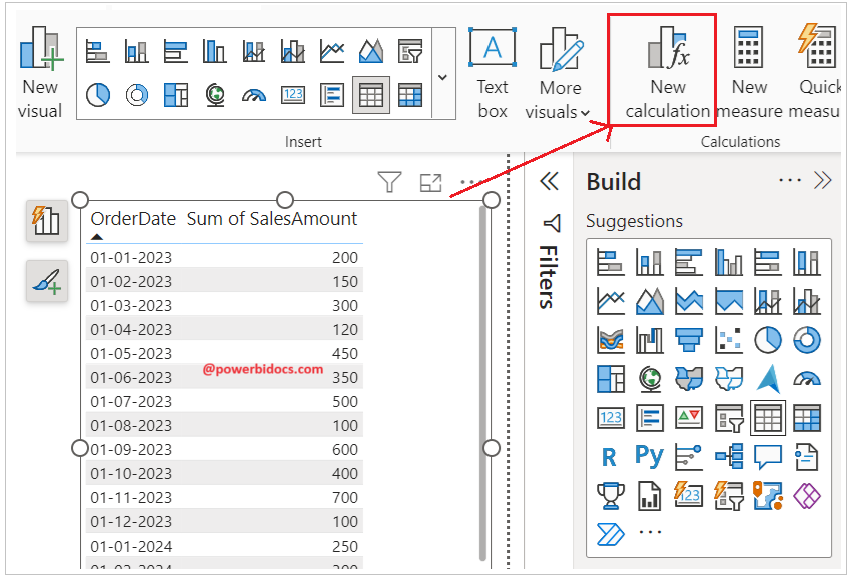
Add a table visual with the Order Date and Sales Amount columns, as shown in the screenshot below for your reference.

After that, select the visual and then choose New Calculation.
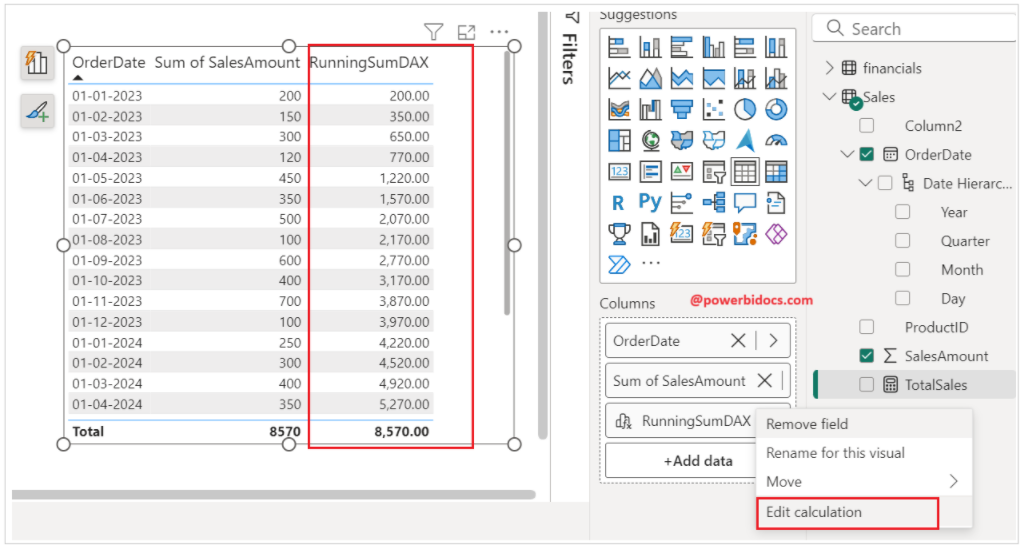
Now, enter the code below in the visual calculation expression.
RunningSumDAX = RUNNINGSUM([Sum of SalesAmount], Rows)

Now you can see the visual calculation has been created, and it is returning running sum.

How to edit visual calculation:
Select the visual, right-click on the visual calculation field, and click on Edit Calculation.
I hope you enjoyed the post. Your valuable feedback, questions, or comments about this post are always welcome.
![]()