
Power BI December 2020 updates – Power BI has released a preview version of the Small Multiples feature! Now, you can create small multiples on your bar, column, line, and area charts.
Refer similar post:- Custom visual for Small multiples line chart
Nov-2022 new feature for Small multiple charts – Unshared Y-axis for small multiple charts
Prerequisite
Download Power Desktop latest version – https://powerbi.microsoft.com/en-us/downloads/
Let’s get started-
Download the sample dataset from here: Global Super Store Dataset
Follow these steps in order to create a small multiples-
Step-1: Enable small multiples preview – click on File tab > Option & settings > Option > Preview feature > Select small multiples

Step-2: These changes required restart, so save the changes and re-open the file.
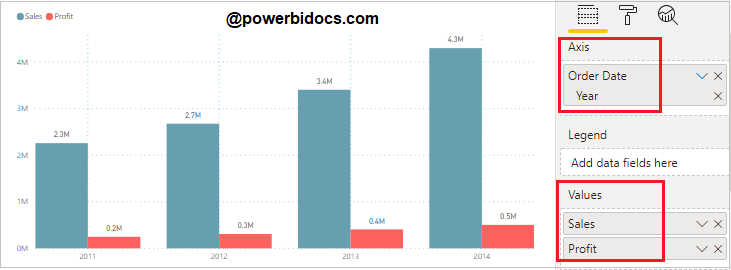
Step-3: Now let’s start with clustered column chart, add one clustered column chart into Power BI report page with some fields as mentioned below-
Step-4: Now drag “Category” column into Small multiples fields. It will split category into small multiples charts under one visual as you can see in below screen shot.

Format Small multiples
You can set the font size, font family & grid layout for small multiples chart. For this select visual & go to format bar and follow these two important properties for chart-
Small multiple title – It allows you to change the title font-family, text size, alignment, position & color for small multiples charts.
Grid layout – from here you can set the number of rows & columns for small multiples charts.
You can see in below screen shot, here we set the number of row & column are 2, so it will split your chart into a 2×2 grid.

Some example of small multiples with Power BI native visuals-

Nov-2022 new feature for Small multiple charts – Unshared Y-axis for small multiple charts
Refer other Power BI topics: Power BI Visuals
Hope you enjoyed the post. Your valuable feedback, question, or comments about this post are always welcome or you can leave us message on our contact form , we will revert to you asap.
![]()