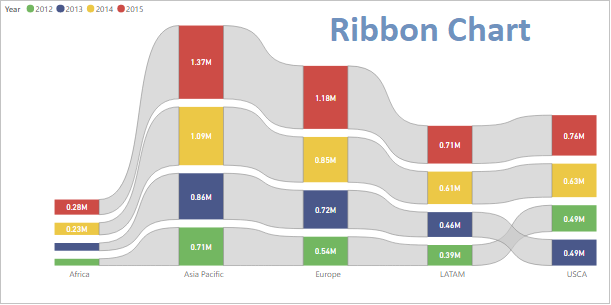
Ribbon chart is Power BI native visual and it is similar like stacked column chart in Power BI with some advance functionality.
With Ribbon Chart you can see the rank & sales changes difference between categories. It always shows large value in each column at the top then the next value comes after.
Let’s get started-
Download Sample dataset- Global_superstore_2016.xls
Follow these steps in order to create a Ribbon chart:
Step-1: Import Orders dataset from Global superstore file.
Step-2: Add Ribbon visual into Power BI report page with some columns.
- X-Axis: Market
- Y-axis: Sales
- Legend: Year

Step-3: Now, to understand the rank change behavior, simply move the mouse cursor between ‘LATAM’ and ‘USCA’.
As you can see in the above screenshot for the year 2013, LATAM sales are $464,733.30, and USCA sales for the year 2013 are $486,629.31, which is less than USCA sales.
So, the rank has dropped by 1 number; earlier, for the year 2013, it was 3, and now it is 4. Rank always counts from top to bottom. See the rank number in the screenshot below.
The gap between each category represents the difference in sales and rank change.
Formatting Ribbon chart-
You can set the font size, font family, title name, X-axis, data labels, and colors for the chart visualization.
Click anywhere on the chart, then navigate to the Format Pane and configure the properties as indicated below.
- General: Allows you to set X axis & Y axis, width & height of chart.
- Legend: Set the font size, font-family, color & position of legend on chart.
- X-Axis: Allows you to modify the appearance of the X-Axis section of this chart.
- Title: Specified the Title name for Chart.
- Data labels: Its enable the values for each category on chart & you can set the display unit, position & orientation of labels.
- Zoom Slider: Enables zoom feature on chart, using this you can easily saw the small values on chart.
- Ribbons: Allow you to set the spacing, connector color, connector transparency, and border for the ribbon.

Refer other Power BI topics: Power BI Visuals
Hope you enjoyed the post. Your valuable feedback, question, or comments about this post are always welcome or you can leave us message on our contact form , we will revert to you asap.
![]()