In this post I will show you how you can find TOP 2 products under each region sales wise in Power BI using DAX function.
Refer similar post: TOP N Filter
Let’s get started-
Download the sample Dataset from below link-
Follow these steps in order to get TOP 2 products under each region-
Step-1: Drag three columns into Table visual – Region, Product name & Sales.

Step-2: Create a measure for Total Sale.
Total Sales = SUM('Global-Superstore'[Sales])
Step-3: Create another measure to get TOP 2 Products
Top 2 Prodcuts =
Var GetProducts = VALUES('Global-Superstore'[Product Name])
Return
CALCULATE([Total Sales],
TOPN(2, ALL('Global-Superstore'[Product Name]), [Total Sales]), GetProducts)
VALUES: It returns one column table with distinct values from specified column.
ALL: Returns all the rows in a table, or all the values in a column, read in details…
TOPN: Returns the top N rows of the specified table.
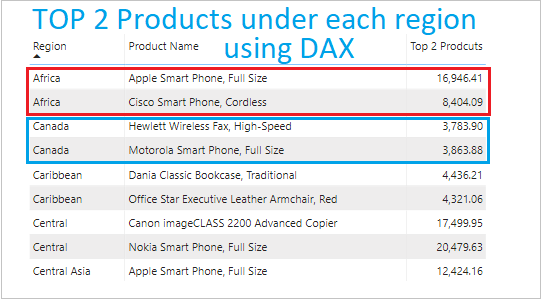
Step-4: Now, drag the measure column into the Table visual, replacing the Sales column.

In above screen shot you can see the final result, it is showing TOP 2 selling products under each region.
Other DAX functions: DAX functions
Hope you enjoyed the post. Your valuable feedback, question, or comments about this post are always welcome.
![]()
Me sirvió perfecto, en mi caso solo necesitaba el top1. Muchas gracias!
Gracias!