
As the name suggests, the Power BI Group feature is used to merge or combine two or more visual values together.
It helps when you want to view and analyze multiple visual values together alongside other data.
Download Sample data : SuperStoreUS-2015.xlxs
Without Group how visual look like:
We have three distinct product categories: Technology, Furniture, and Office Supplies.

Follow these steps in order to create a Group-
Now, create a group to merge Technology and Furniture values together.
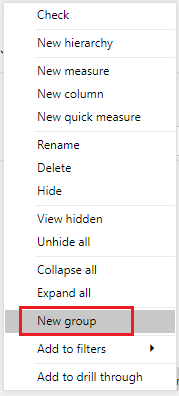
Step-1: Right-click on the ‘Product Category’ field and select ‘New Group’.
Step-2: Select ‘Technology’ and ‘Furniture’ by using Ctrl + Click.

Step-3:Click the “Group” button, modify the group members’ names, and then click “OK.”

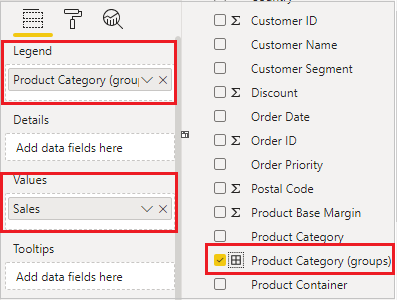
Step-4:Group created successfully. Now, select a pie chart and drag the new ‘Group’ field to the Legend and the ‘Sales’ field to Values.
Step-5: See the final Output with group.

How to Modify Group?
Right click on Group, select Edit groups

Ungroup the previous group members and create new groups
Now, let’s form new groups and ungroup the previous ones:
- Select the Group members and click the ‘Ungroup’ button.
- Then, follow the same process. Using Ctrl+Click, select ‘Technology’ and ‘Office Supplies,’ and click the ‘Group’ button.”

Hope you enjoyed the post. Your valuable feedback, question, or comments about this post are always welcome or you can leave us message on our contact form , we will revert to you asap.
Recommended Post:
![]()