
Power BI provides you to very cool features of visual Interaction, by default this feature is enable, that’s means when you select any slicer value or click any visual by default all visuals get filtered on the basis of click or select value.
You can disable interactions between visuals. Let’s begin with an example:
Step-1: Download Sample data : SuperStoreUS-2015.xlxs
Step-2: Drag the following three visuals onto the page:
- Slicer: Drag Product Category in Field
- Table: Drag Product Category, Region, Sales, Profit in Values
- Line & Clustered Column Chart: Drag Region in Shared, Product Category in Column Series, Sales in Column values, Profit in Line values

Step-3: Now, choose “Furniture” from the slicer. Refer to the image below for the output, both visuals are filtered based on the selected slicer values. This behavior is enabled by default due to visual interactions.

How to disable visual interactions?
Now we will off Table Interactions for Slicers & Chart, that’s mean Table visual will not change on slicer or other visual click.
- Select Slicer & Go to the Format tab
- Click on Edit Interactions

- Now click on Table visual None Icon

- Click on Edit Interaction button under Format tab to close & save this change
- After that select Chart & Go to Format Tab and click on Edit Interaction button
- Click on Table visual None Icon

- Click on Edit Interaction button under Format tab to close & save this change
The interaction for the table has now been disabled. Proceed to apply a filter on the slicer and observe the results.

Now click on Chart Visual and see the result:
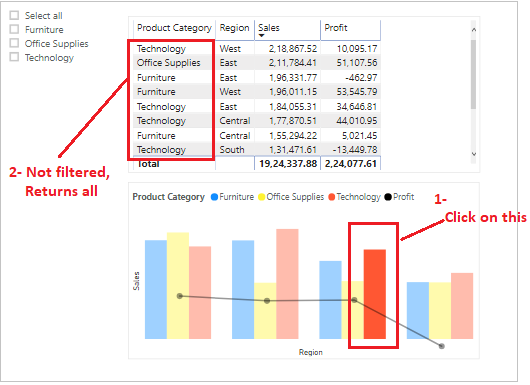
As you can observe, the table is not filtering when clicking on the chart and slicer values due to the “Edit Interactions” being turned off.
Hope you enjoyed the post. Your valuable feedback, question, or comments about this post are always welcome or you can leave us message on our contact form , we will revert to you asap.
Recommended Power BI Post:
![]()
Edit interactions are turned off for a slicer S1 between other slicers s2, s3 and other visuals on a page. But i make selection on slicer S1, why does all the visuals and slicers spin/refresh causing queries in performance analyzer?. Any thoughts please advise
Thanks