
In this blog, I will discuss Dynamic Row-Level Security (RLS) with an organizational Hierarchy in Power BI.
Row-Level Security (RLS) in Power BI is a feature that restricts data visibility in reports based on user roles. It ensures that users only see the data relevant to their assigned role, allowing for secure and personalized access to report information.
Let’s first understand the company hierarchy data and how Row-Level Security (RLS) applies here.
In the hierarchy visual, Sandeep is the manager at the top level. Reporting to him are three team leads — Antonio, Aria, and Dinesh. Under these team leads, we have developers and IT support employees. Specifically:
- Jacobs and Jack report to Antonio.
- David reports to Aria.
- Matt and John report to Dinesh.

This gives us three levels in the hierarchy: Manager, Team Lead, and Developer/IT Support.
Our RLS requirement is structured as follows:
- Manager: Can see data across all levels of the hierarchy.
- Team Lead: Can see their own data and the data of their direct reports. For example, Antonio can view his own data along with Jacob’s and Jack’s data. The same applies to the other team leads for their respective teams.
- Developers/IT Support: Can only see their own data since they don’t have any direct reports.
To implement Dynamic RLS for an organizational hierarchy, it’s essential to have hierarchy data properly structured with parent-child relationships. Specifically, your data should include employee details along with the respective reporting manager’s ID for each employee. For example, in our case, each employee’s record is tagged with their reporting manager’s ID.

If your data is not already in this format, you will need to restructure it accordingly to apply Row-Level Security (RLS) based on the organizational hierarchy. This setup is crucial for RLS to work effectively.
Now let’s start the practical part:
Creating a calculated column in the EmployeeHierarchy table to get the hierarchical path of employees.
To create a calculated column, right-click on the dataset name and select “New Column.” Then, write the following DAX code.
Path = PATH(EmployeeHierarchy[EmpId], EmployeeHierarchy[ManagerID])

The PATH function creates a hierarchical path for each employee by tracing their reporting structure — starting from the top-level manager down to that employee. It uses:
EmpId: The unique ID of each employee.ManagerID: The ID of the employee’s manager.
The result is a text string that shows the entire reporting chain, separated by a pipe symbol (|).
How the Path column works:
- Sandeep Raturi (EmpId 1): Top-level manager, so Path = “1”.
- Antonio Moreno (EmpId 2): Reports directly to Sandeep, so Path = “1|2”.
- Jacobs (EmpId 7): Reports to Antonio → who reports to Sandeep, so Path = “1|2|7”.
- Matt (EmpId 5): Reports to Dinesh → who reports to Sandeep, so Path = “1|4|5”.
Create an RLS role
Go to Modeling > Click on Manage roles, and then click on Roles.
The first role we’ll create is for admin-level users, who can see all the data in the report.
Assign the name role name “admin”, For the Admin role, we won’t select any table or write any DAX code because the admin can access all the data. This role could be assigned to the CEO or any high-level executive in the company.

Now, create another RLS role. Double-click on the “Untitled” name and rename it to “user_role”. Next, select the “EmployeeHierarchy” table, then click on “Switch to DAX editor” under the Filter Data section. Finally, write the following DAX code.
PATHCONTAINS(EmployeeHierarchy[Path],
MAXX(
Filter(
EmployeeHierarchy,
[EmployeeEmail]= USERPRINCIPALNAME()
)
,EmployeeHierarchy[EmpId]
)
)

DAX Explanation:
- USERPRINCIPALNAME() gets the logged-in user’s email.
- We filter the EmployeeHierarchy table to get that user’s data.
- MAXX is an iterator function that evaluates an expression for each row in the filtered table and returns the maximum value. Here, it’s getting the maximum EmpId — but since the filter keeps only one row (matching the current user’s email), it just returns that user’s EmpId.
- PATHCONTAINS checks whether that user’s EmpId exists in the Path column — which helps determine if an employee falls under the current user in the organizational hierarchy.
Testing RLS in Power BI Desktop:
Let’s test the RLS in Power BI Desktop. We will test the RLS with one of the Team Lead’s login. Open the Manage Roles window, comment out the USERPRINCIPALNAME() function in the code, and replace it with the Team Lead’s email ID.
PATHCONTAINS(EmployeeHierarchy[Path],
MAXX(
Filter(
EmployeeHierarchy,
[EmployeeEmail]="antonio.moreno@sandeepraturi.onmicrosoft.com" --USERPRINCIPALNAME()
)
,EmployeeHierarchy[EmpId]
)
)

After that, click on View As, select user_role, and click OK.

As you can see in the screenshot below, Antonio can only see the data of his direct reporting employees along with his own data. In the same way, you can test it for any employee by simply changing the email ID.

Now, let’s assign roles to the users and test RLS in Power BI Service:
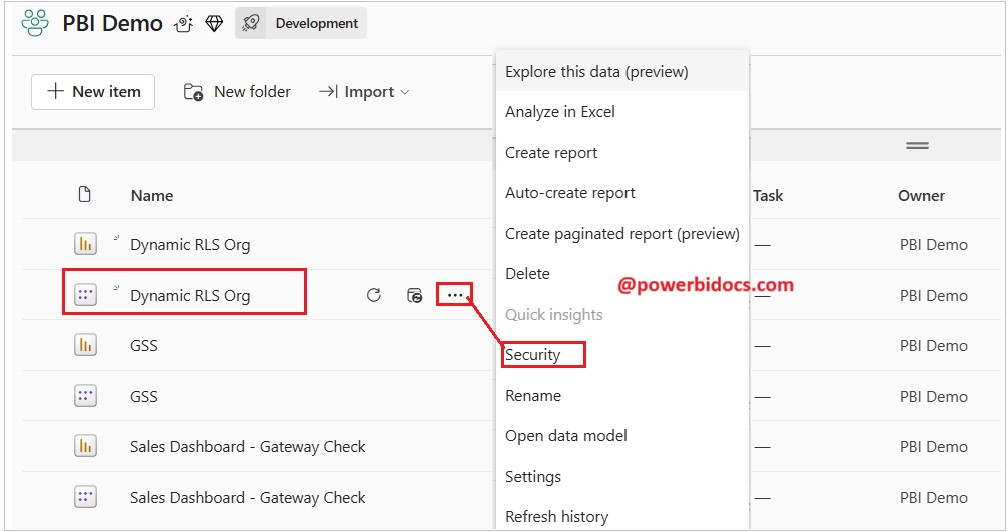
Publish the report to Power BI Service, then click on the three dots next to the report’s semantic model and select Security.
Now, select the user_role and add employees by their email IDs. You can search for employees by their name or email and add them. If an AD group has been created for them, you can add the AD group here as well.
As you can see in the screenshot below, I added three users: Sandeep (Manager), Dinesh (Team Lead), and David (Developer).

Now, Test the user roles:
1 – Test the role for the Manager:
As per the RLS we implemented on organizational hierarchy data, the manager can see all data. Here you can see all data is visible to the manager.

2 – Test the role for the Team Lead:
I logged in from Dinesh’s account (Team Lead), and as you can see, he can only see the data of his direct reporting employees(Jhon and Matt), along with his own data.

3 – Test the role for the Developer:
Finally, let’s check the developer level. David is a developer, and since no one reports to him, he can only see his own data.

Let’s test the Admin role:
Now, assign the Admin role to a user and check whether they can see all the data or only their own data.

As an admin, the user can see all the data.

Thanks for reading this post! I hope you found it helpful. Feel free to share it with others or your teammates so they can benefit from it too. 😊
![]()
May i have the the data
Hi, Copy the dataset from my blog: https://powerbidocs.com/2020/11/20/dax-path-function/