
Power BI Report Page Tooltips is very cool feature of Power BI Desktop, it help us to explore our visuals more deeper and it is very easy to use. Tooltips appears when the cursor is hovering over a visual.
Let’s get started-
Sample Dataset download from here- Global Super Store Dataset
Now create two separate page, one main page & second for Tooltips:-
Category Sales Page-
Add one clustered column chart with below columns-
Axis: Region, Values: Sales

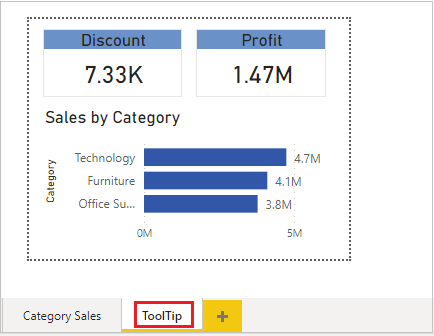
Create second page for Tooltip:
Enable & set the page size for Tooltip-
- Click anywhere on blank page then go to Format section.
- Go to Page information > Enable Tooltip.
- Then click on Page Size and select page size type Tooltip, by default it is 16.9.
- Then go to View menu tab, and under Page View select ‘Actual Size’, see below right side screen shot.

After that add some visuals in Tooltip page, which you want to display as in Tooltip.
Now enable Tooltip for Category Sales Page
Go to Format section > Enable Tooltip > Select Tooltip Page name.

Now mouseover the any bar on clustered column chart and you will see the Tooltip.

Watch Practical video :-
Hope you enjoyed the post. Your valuable feedback, question, or comments about this post are always welcome or you can leave us message on our contact form , we will revert to you asap.
Recommended Post:
How to create Custom Theme in Power BI
Enable Syncs Slicers in Power BI
![]()