
In Power BI Desktop you can create your own Hierarchies, it provides drill down action to the BI report.
When a visual has a hierarchy, it enables the ability to drill down for additional relevant details.
For an example, you might have a visualization that shows the Region hierarchy with Sales and you want to drill down on a specific product category that is under-performing.
Let’s start with an example, If you do not already have a sample dataset, you can download one from the link below.
Create a Hierarchy
Step-1: Hierarchy Levels for data: Region > Product Category >Product Sub-Category
Step-2: Right click on Region field then select “Create Hierarchy”
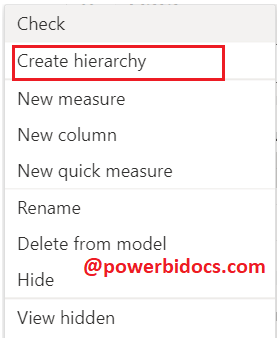
Step-3: Region hierarchy created

Step-4: Now Add Product Category & Product Sub-Category under Region hierarchy.
- Right click on Product Category and click on Add to hierarchy then select Region Hierarchy
- Right click on Product Sub-Category and click on Add to hierarchy then select Region Hierarchy

Create a visual to using Hierarchy
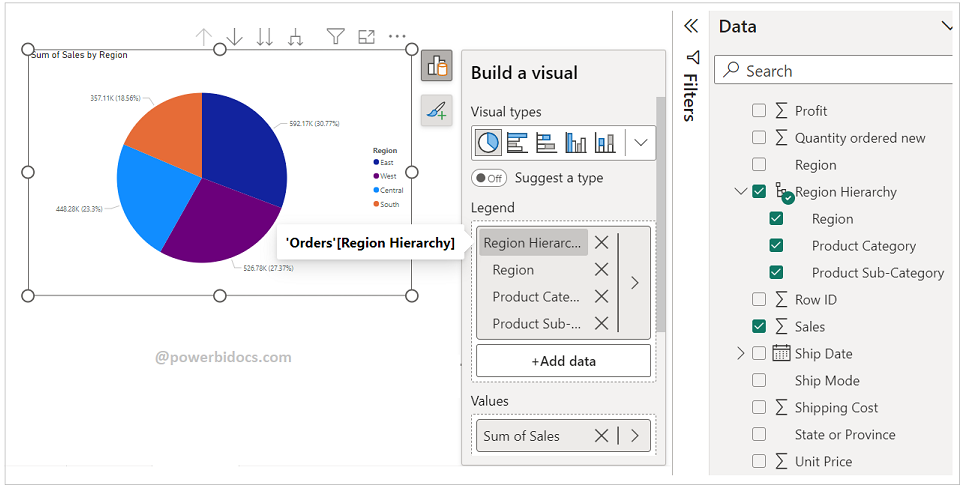
Click on first icon and Add Region Hierarchy column to Legend and Sales to Values section.
For old version of Power BI(Prior 2023)-
Add a Pie Chart to the canvas, and drag the Region Hierarchy to the Legend and Sales to Values.

Enable drill down on Pie chart
Step-1: When hovering over the Pie chart, four icons appear as shown in the image below.
- First icon: It is used to drill up the data one step back
- Second icon: It is used to enable drill down mode
- Third icon: Display next level Hierarchy
- Fourth icon: It is used to expend all Hierarchy

Step-2: To enable Drill Down mode, click on the second icon (Drill Down icon).

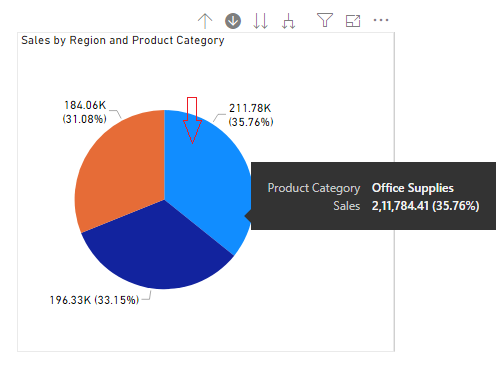
Step-3: Now click on the Pie chart any point, it will drill down and display to you Product Category under East Region.

Step-4: Now click on any Product category, it will drill down to you Product sub category under that Category.
Step-5: See the final Product Sub category under that category.

Step-6: Now using Drill Up icon you can go back step by step

In same way you can use Next level hierarchy(icon 3) & Expand all hierarchy(icon 4).
Hope you enjoyed the post. Your valuable feedback, question, or comments about this post are always welcome or you can leave us message on our contact form , we will revert to you asap.
Recommended Post:
![]()
Well done. Very clear. Can I add columns to a hierarchy, or does it have to be a measure?
Yes, you can add the columns.