
In Power BI Desktop you can change the Visual title Dynamically on the basis of slicer selection value.
Note:
Download Sample Dataset: Excel Sample Dataset for practice
Let’s understand with an example:
Step-1: Sample data visual as below.

Step-2: Now Create Measure for Dynamic Title, Right click on Dataset then click to New measure.

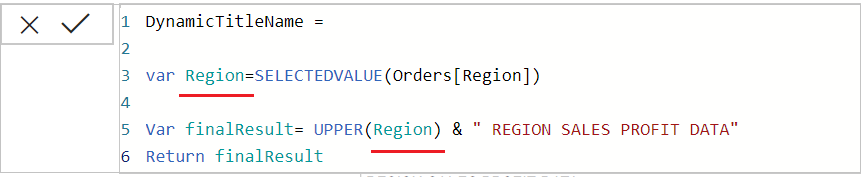
Step-3: After that one DAX formula screen appears, write measure here.
DynamicTitleName =
Var Region= SELECTEDVALUE(Orders[Region])
Var finalResult= UPPER(Region) & " REGION SALES PROFIT DATA"
Return finalResult
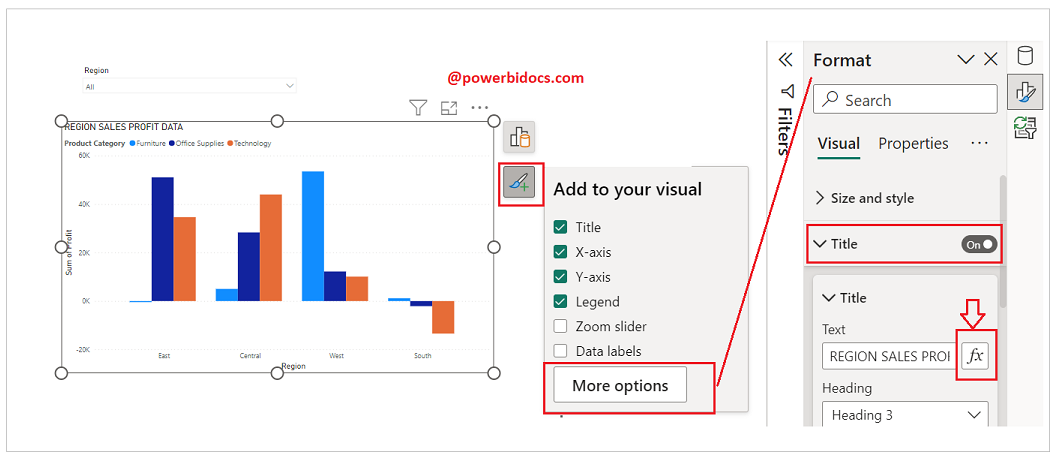
Step-4: Now link Measure with visual Title using conditional formatting.
For 2022 onwards version-
Select the chart> Click on Second Icon> Click on More Option> Enable Title from Format Pane> Click on fx Icon.
For old version Power BI desktop –
Select Chart Visual then go to Format pane > Enable Title > click on three dot > then click on Conditional formatting.

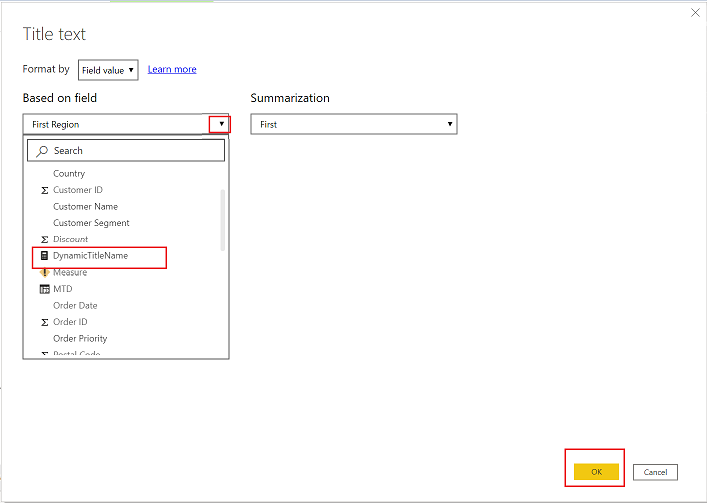
Step-5: Now select Measure and click to OK button.
Step-6: Now Select any region from region slicer & see the visual title.
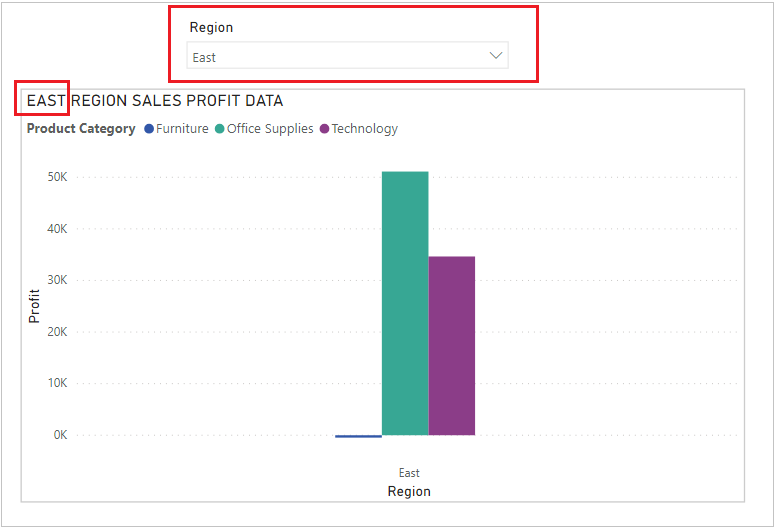
Now select another region-

Note: It will work only for single slicer section value at a time.
Hope you enjoyed the post. Your valuable feedback, question, or comments about this post are always welcome or you can leave us message on our Contact form , we will revert to you asap.
![]()
With something like
Var Region = CONCATENATEX(Orders;Orders[Region];”, “)
instead of
Var Region = SelectedValue(Orders[Region])
It would also work with more than a single slicer section value at a time.
It will not work for multiple selection i think..