
In this blog, you will learn how to optimize Power BI reports and enhance their performance. Here are some specific techniques for optimizing Power BI reports:
DirectQuery vs. Import: Choose the right data connection mode based on your needs. DirectQuery is faster for smaller datasets, while import mode improves performance for larger data.
Minimize Visuals: Restrict the number of visuals on a single page or dashboard, as each visual consumes data processing resources.
Data Transformations: Optimize data transformations in Power Query Editor using efficient functions and avoiding unnecessary steps.

Filters and Slicers: Use filters and slicers to control the data volume displayed, reducing processing strain.
Performance Analyzer: Utilize Power BI’s Performance Analyzer tool to find performance bottlenecks and identify areas for improvement.

Star Schema: Utilize a star schema for efficient data queries. Snowflake schemas can lead to slower performance.

Limit Data: Include only necessary columns and tables in your data model. Having extra data can make things slower.
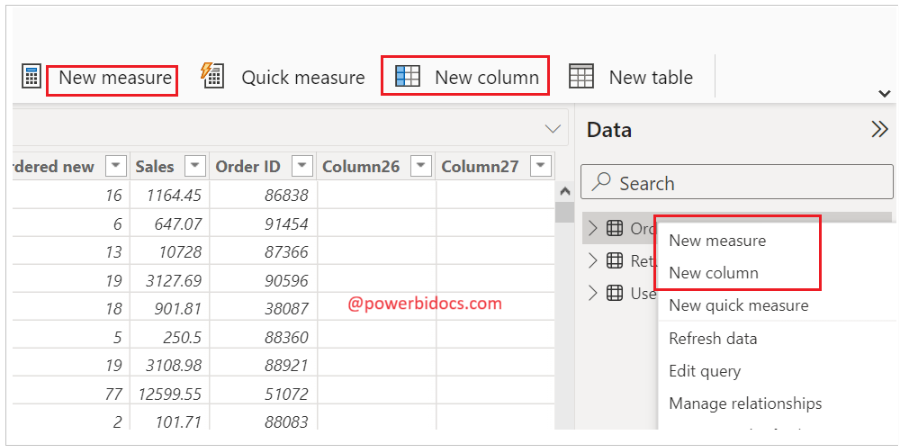
Use Measures: Wherever possible, use measures instead of calculated columns for aggregations and calculations. Measures are pre-compiled and faster.
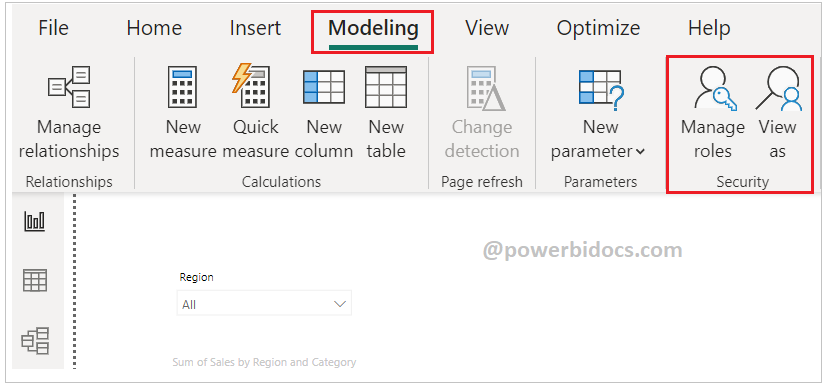
Row Level Security: Implement row-level security to limit data access, improving performance for individual users.
Optimize Source Database: Ensure that the source database has appropriate indexes on columns used in queries to speed up data retrieval.
![]()